kubernetes-pod-monitor
Kubernetes Pod Monitor
Kubernetes Pod Monitor actively tracks your K8S pods and alerts container restarts along with its crash logs thereby decreasing the mean time to detect (MTTD). The features include:
- Alerting using slack integration
- Capturing critical crash logs and storing them in Elasticsearch
- Historical pod crashes
- Storing container state that gives transparency on pod lifetime and status before the termination
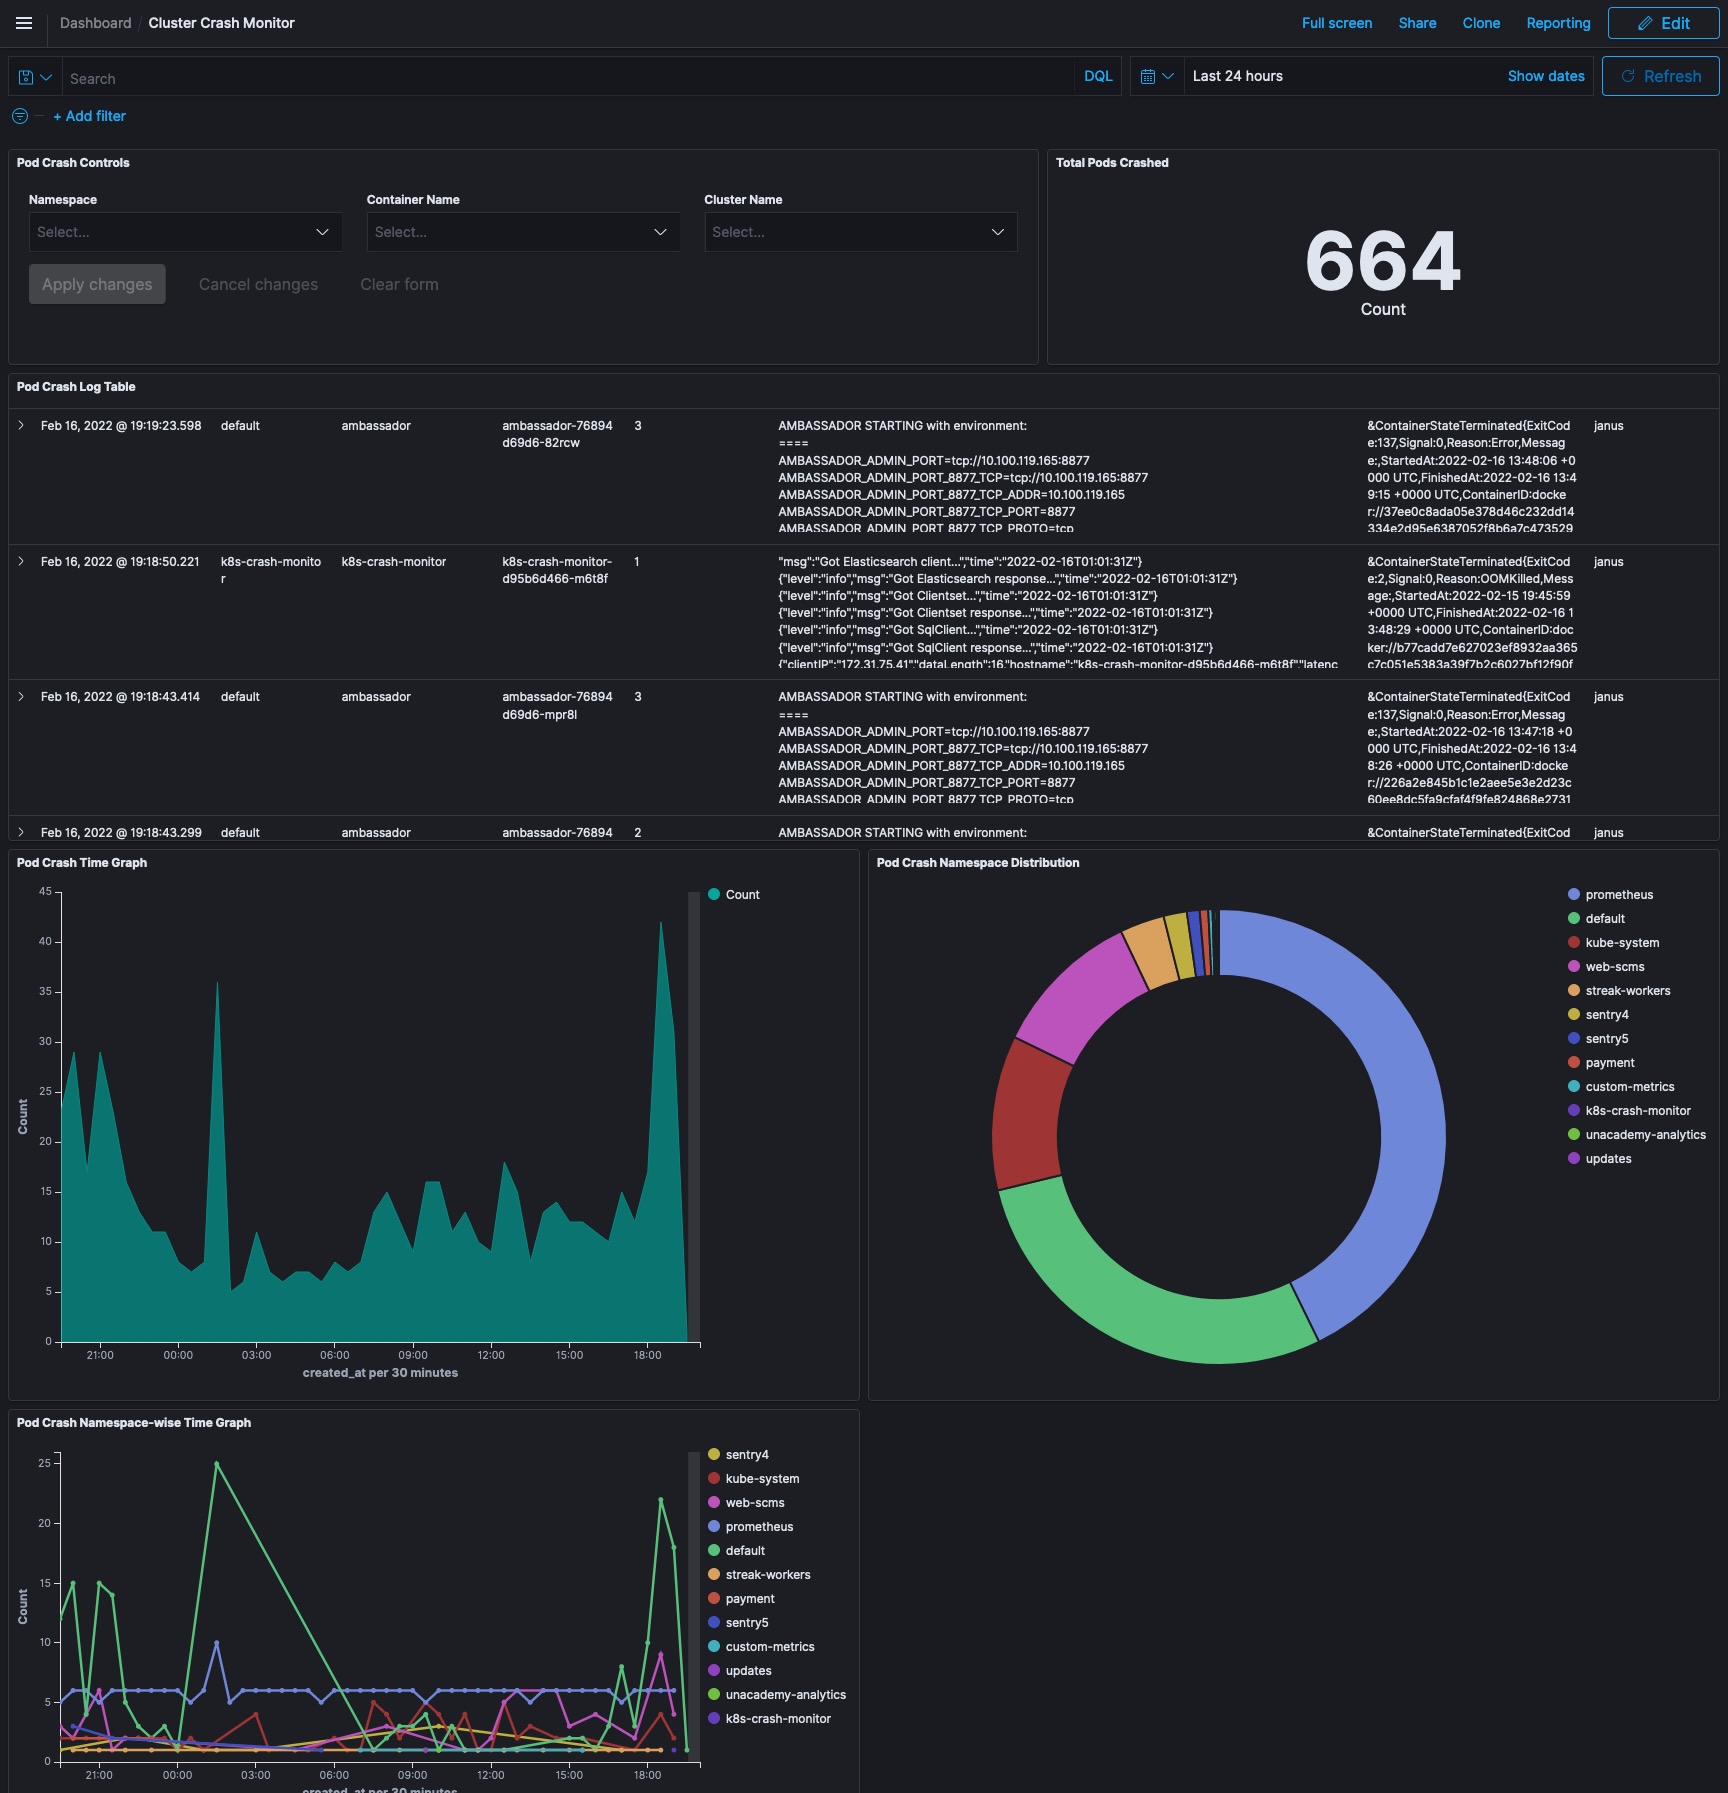
- Kibana Visualization for filtering through crashes
- Ability to configure slack channel based on namespace
- Ability to ignore certain namespaces

Requirements
The following table lists the minimum requirements for running Kubernetes Pod Monitor.
| Tool | Minimum version | Minimum configuration |
|---|---|---|
| Kubernetes | 1.13 | 100 MB RAM |
| MySQL | 5.7 | - |
| Elasticsearch | 6.5 | 4 GB RAM |
To send alerts via Slack integration, access tokens can be generated here: https://api.slack.com/authentication/token-types
Getting Started
You can deploy Kubernetes Pod Monitor on any Kubernetes 1.13+ cluster in a matter of minutes, if not seconds.
Using Helm chart (recommended)
- Apply MySQL migrations
- Install using the Helm chart
- Import Kibana dashboard into Elasticsearch by following https://www.elastic.co/guide/en/kibana/current/managing-saved-objects.html
Using docker compose
- Add kuberentes configuration (kubeconfig) file to
configdirectory and updateCLUSTER_NAMEenv variable in docker-compose -
Start docker compose using:
docker-compose up --build
MySQL Migrations
You can run the following queries to create the required database and tables:
CREATE DATABASE kubernetes_pod_monitor
CREATE TABLE `k8s_crash_monitor` (
`clustername` char(64) NOT NULL,
`namespace` char(64) NOT NULL,
`podname` char(255) NOT NULL,
`containername` char(255) NOT NULL,
`restartcount` int(11) DEFAULT NULL,
`retries` int(11) DEFAULT NULL,
`edited_at` int(11) DEFAULT NULL,
PRIMARY KEY (`clustername`,`namespace`,`podname`,`containername`)
);
CREATE TABLE `k8s_pod_crash` (
`id` int(11) NOT NULL AUTO_INCREMENT,
`clustername` varchar(120) NOT NULL,
`namespace` varchar(120) NOT NULL,
`containername` varchar(120) NOT NULL,
`restartcount` int(11) NOT NULL DEFAULT '0',
`date` datetime(6) DEFAULT NULL,
PRIMARY KEY (`id`)
);
CREATE TABLE `k8s_pod_crash_notify` (
`clustername` varchar(255) NOT NULL,
`namespace` varchar(255) NOT NULL,
`slack_channel` varchar(255) NOT NULL,
PRIMARY KEY (`clustername`,`namespace`)
);
CREATE TABLE `k8s_crash_ignore_notify` (
`clustername` varchar(255) NOT NULL,
`namespace` varchar(255) NOT NULL,
`containername` varchar(255) NOT NULL,
PRIMARY KEY (`clustername`,`namespace`,`containername`)
);
Configuring notifications
You can easily configure slack notifications, by using the notification management utility.
The following lists the minimum requirements for running this utility:
- Python v3.6 or higher
- PyMSQL package to manage MySQL tables: https://pypi.org/project/PyMySQL/
pip3 install PyMySQL - Tabulate package to render tables: https://pypi.org/project/tabulate/
pip3 install tabulate
Run the utility and follow the onscreen steps:
python3 scripts/notification_management_utility.py
Sample Elasticsearch document
An indexed document in Elasticsearch consists of the following fields:
namespace: Namespace of the crashed podpod_name: Name of the pod that crashedcontainer_name: Container name which restarted. Helpful in case of multiple containers in a podcreated_at: Timestamp in millisecondscluster_name: Name of the clusterlogs: Logs of the container before restartingrestart_count: Number of times the pod restartedtermination_state: State of the container with reason, message, started at timestamp and finished at timestamp
{
  "_index": "k8s-crash-monitor-2022.03.11",
  "_type": "_doc",
  "_id": "Zn3DeH8BpsFVE9gY0heI",
  "_version": 1,
  "_score": null,
  "_source": {
    "namespace": "prometheus",
    "pod_name": "prometheus-server-68bf5b8675-bxpq6",
    "container_name": "prometheus-server",
    "created_at": 1646998573563,
    "cluster_name": "dev-001",
    "logs": "level=error ts=2022-03-11T11:35:53.889Z caller=main.go:723 err=\"opening storage failed: zero-pad torn page: write /data/wal/00000269: no space left on device\"\n",
    "restart_count": 183,
    "termination_state": "&ContainerStateTerminated{ExitCode:1,Signal:0,Reason:Error,Message:,StartedAt:2022-03-11 11:35:53 +0000 UTC,FinishedAt:2022-03-11 11:35:53 +0000 UTC,ContainerID:docker://3cc68f0bdff60e4ac3ab494235225af22bfa3efa97ab5ea55464fcb510dbb0f6,}"
  },
  "fields": {
    "created_at": [
      "2022-03-11T11:36:13.563Z"
    ]
  },
  "sort": [
    1646998573563
  ]
}
Demo
https://user-images.githubusercontent.com/22556869/160109898-97a7fd96-33cc-4e1c-844a-226a030b9e7e.mov
Software stack
Golang application. Kubernetes. Elasticsearch. MySQL.
Contributors
Shivam Gupta |